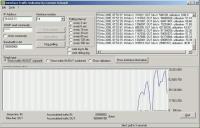
Download Interface Traffic Indicator for windows
On this page you are able to download Interface Traffic Indicator program of windows section of network monitoring & management category, as well as familiarize with its brief description, operating system type, kind of license and a program popularity rating. Here is also the information about previous user views and a program product downloads amount. In order to download Interface Traffic Indicator you have to enter the confirmation code in the appropriate form and click on the "Download Interface Traffic Indicator" link. The download will begin in a few second in case of correct code input.
If you are not convenient with the version or license type you are able to choose similar program products making use of links represented below or going back to windows section.
OS: Windows2000/Windows2003/WinME/WinXP
License: Freeware
Rating: 0
Views/Downloads: 375/0
If you like this software, please consider donating. Follow the Paypal link or Amazon wishlist at: http://software.ccschmidt.de/appreciation.html
Please report bugs and feature requests to: [email protected]
What does it do and how does it work? Inftraf is a tool that requests IN/OUT octet data (MIB2) from SNMP-capable network interfaces. You can use this program in a professional network environment to monitor selected network interfaces (even backplane ports if the device provides the information) or you can monitor your home network or cable/modem/ISDN connection to the internet. You can monitor bits/sec, utilization and accumulated traffic.
Enter IP address and SNMP read community into the fields and click on FIRST CONTACT. The program will then try to retrieve all interface information of the device. If successful, this will enable the START POLLING button. Select a polling interval and an interface and start polling. Values in graph are calculated and shown as either bits or bytes per second or utilization in percent. Just select the appropriate graph. Error messages are shown in the statusbar at the bottom. Other functions provided: - Show device information - Reset all values and graphs - Options dialog - Two log variations: normal log also shown in GUI and a debug log that shows all polling information that was retrieved. Both can be written to files.


 Set as homepage
 Add to favorites


